Xin Tao
Can the United States’ legislative data be used for legislative prediction? The answer is yes. In the complex legislative process of the United States, the fate of each bill is filled with uncertainty. However, with the rapid development of big data and advanced analytical techniques, we now have the possibility to unveil the mysteries behind these processes. In this article, we will explore how to predict the success or failure of bills by analyzing a vast amount of legislative data from the U.S. Congress. From acquiring and processing official data to a deep analysis of key factors influencing legislative outcomes, we will demonstrate step by step how to use data-driven methods to forecast the trajectory of legislation and uncover patterns and trends in policy-making. Our team’s past experience has shown that these methods can assist policymakers, analysts, and the industry in more effectively managing various risks. This article aims to introduce the principles of these methods and inspire more people to engage in such research, contributing further to this field.
Legislative Data Acquisition and Processing
Acquiring data is the foundation of analysis and prediction. Obtaining legislative data in the United States is relatively straightforward. Relevant links can be found on the official websites of both houses of Congress, and the GovInfo website provides bulk data downloads of legislative data from the past decade. This data includes various types of XML-formatted legislative documents with rich tag information covering bill text, sponsors, co-sponsors, committee responsibility, voting at different stages, legislative progress, and timestamps, among other crucial details. After downloading the data, databases can be constructed using the key information from XML files, as shown in the structure below, for further analysis. Bill texts can also be classified and labeled further using natural language processing algorithms. Depending on the research objectives, researchers can design different database structures and analysis algorithms. This article will introduce some approaches to analyzing legislation related to China.

Legislative Data Analysis and Prediction: Basic Probability Model of Legislative Process
In the United States, the formulation of new policies involves a series of steps from legislation to implementation. This legislative process is typically fixed:
- First, a bill is introduced by a member of either the Senate or the House of Representatives.
- Subsequently, depending on the policy area of the bill, it is referred to a specific committee for review and amendments.
- After deliberation and amendments in the committee, the bill is sent to the full chamber for further consideration and modifications.
- Following approval by the chamber, the bill is transmitted to the other house (either the House of Representatives or the Senate) and goes through a similar review process.
- If there are discrepancies between the versions passed by the two houses, a joint committee is formed to reconcile these differences and produce a consensus version, which is then sent back to both houses for a final vote.
- The bill is subsequently submitted to the President for signing. The President has the option to either veto or sign it into law within a certain time frame. If signed, the bill becomes law after a specified period.
- If the bill is vetoed by the President, it returns to both houses for reconsideration. However, if 67% of lawmakers vote to override the President’s veto, the bill automatically becomes law after a certain period. Otherwise, both houses need to submit the modified version to the President again.
- If this final process is not completed before Congress adjourns, the bill cannot become law. If the President intentionally delays the signing process and the bill expires, it is referred to as a “pocket veto.”
As shown in the figure below, each of the above steps has its own associated time and probability of success. The key to analyzing and predicting the legislative process lies in quantitatively modeling these probability processes.
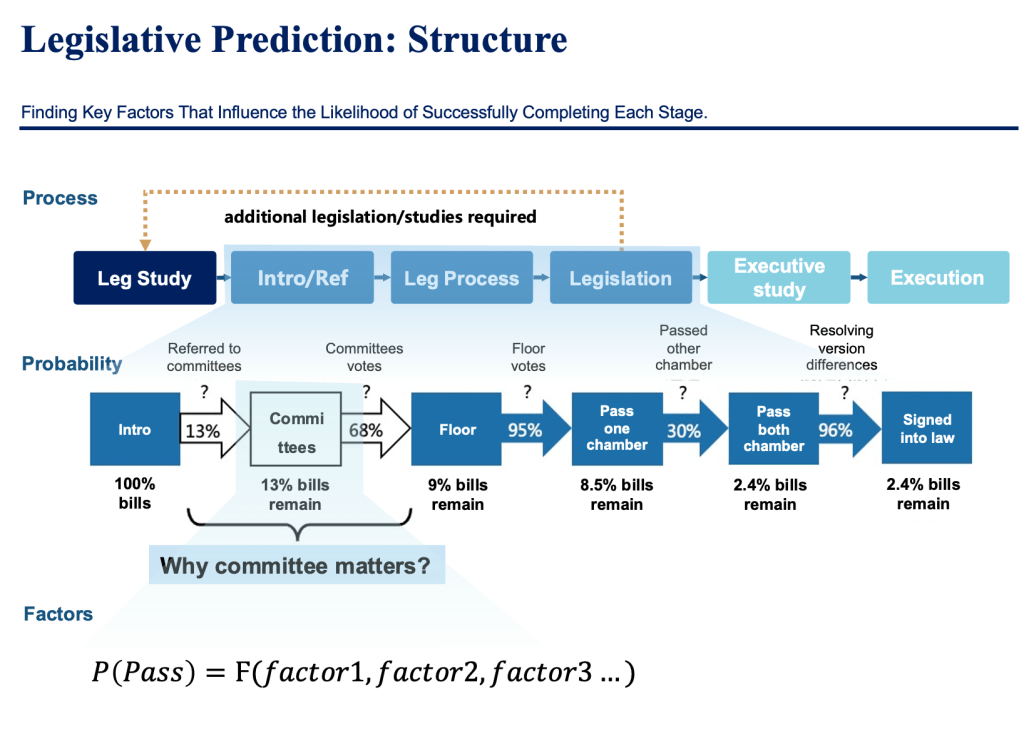
Most bills expire because they cannot complete the above process, and only 2.4% of bills become law. The most challenging step for bills is typically the committee review, with only about 13% of proposals formally considered by the committee, and one-third of those being shelved by the committee. Ultimately, only 9% of proposals make it out of the committee. Another significant hurdle lies in the other house, where even if one house passes a bill, there is still approximately a 70% chance of it being stalled in the other house.
The analysis above is quite rudimentary. In reality, bills go through nearly a hundred different stages, and a more precise predictive approach involves statistical modeling of the probability and timing of transitions between different stages using Bayesian probability and Markov chains. The figure below illustrates our team’s general statistics on the state transitions of legislative members, serving as the basis for our precise analysis and prediction of the legislative process, also understood as a Bayesian prior probability.
In practice, the probability of progressing to the next legislative stage is influenced by many factors and is a conditional posterior probability. For example, if the bill’s sponsor holds a high social position within Congress, the probability of the bill smoothly passing through the committee is significantly higher. Therefore, the focus of the next step in improving the model lies in understanding the impact of various conditions on different legislative processes and calculating posterior probabilities when multiple conditions occur simultaneously.

Legislative Data Analysis and Prediction: Factors of Influence
There are many factors that influence state transitions, and this article will not cover all possible factors affecting legislation. However, we will illustrate the principles of how to measure these factors through two examples, allowing readers to construct modeling methods suitable for their research.

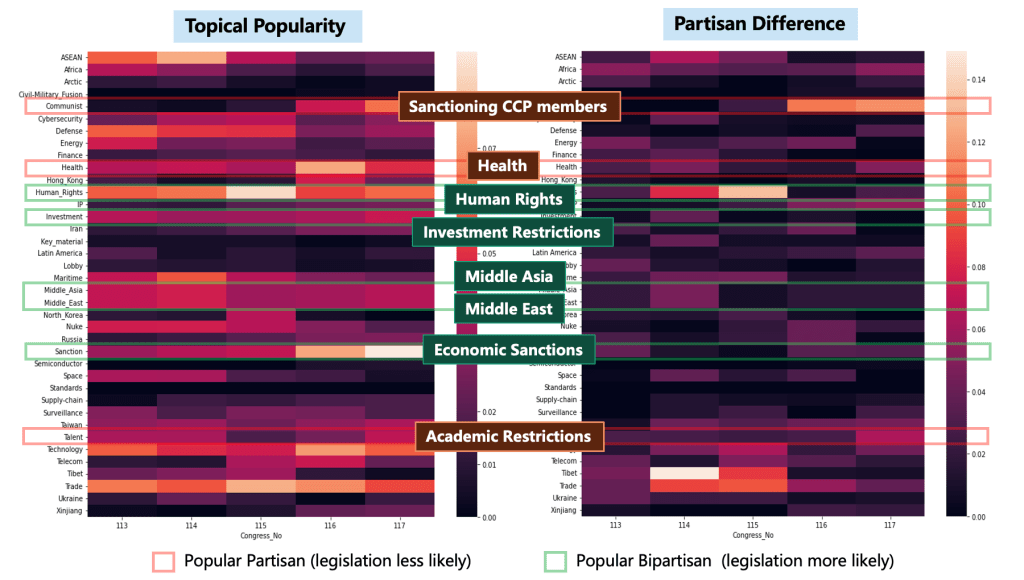
First, we will discuss the impact of bill topic popularity and bipartisan consensus on the probability of legislation. This aspect is interesting. For legislation in specific areas, congressional committees may decide whether to further discuss a bill based on the popularity of the bill’s topic. Whether the internal committee vote can pass depends on the bipartisan consensus because passage requires the support of the majority of committee members, including support from both parties. Popularity can be measured by the frequency of a specific issue’s appearance, while bipartisan consensus can be assessed by the balance of votes and party support data. The figure below shows the popularity and bipartisan consensus of different topics related to China in the 116th and 117th Congresses. Bright areas represent the popularity of topics (on the left, with brighter colors indicating higher popularity), and the degree of controversy of topics (on the right, with brighter colors indicating higher controversy and a lack of consensus). It can be seen that bills related to restricting Chinese academics have high popularity (mainly supported by Republicans) but lack bipartisan consensus. On the other hand, bills related to restricting investment in China have both popularity and bipartisan consensus. Therefore, we can infer that bills related to restricting investment in China are more likely to pass through the committee and eventually become law. From the results, this inference is entirely correct.
Secondly, social relationships within the party and in Congress are also crucial factors. For example, if the bill’s sponsor holds a high social position within Congress, the probability of the bill’s passage is higher. On the other hand, if there is a high level of cooperation between the two parties on a specific issue, the probability of legislation related to that issue is also higher. By analyzing lawmakers’ voting data and co-sponsorship data, we can infer lawmakers’ cooperation and further create an adjacency matrix of lawmaker cooperation for building social network graphs and conducting calculations. in the same Congress.
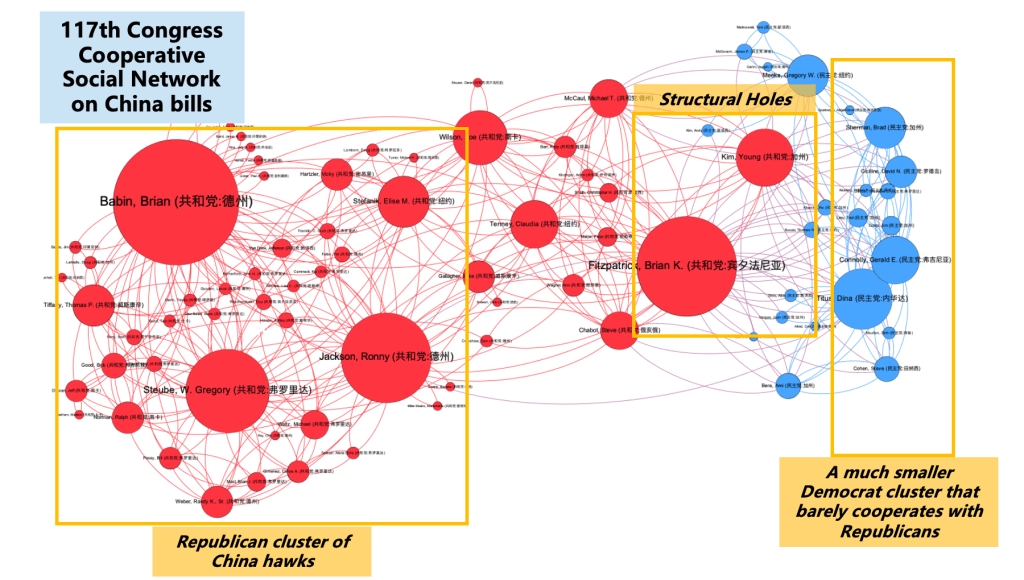
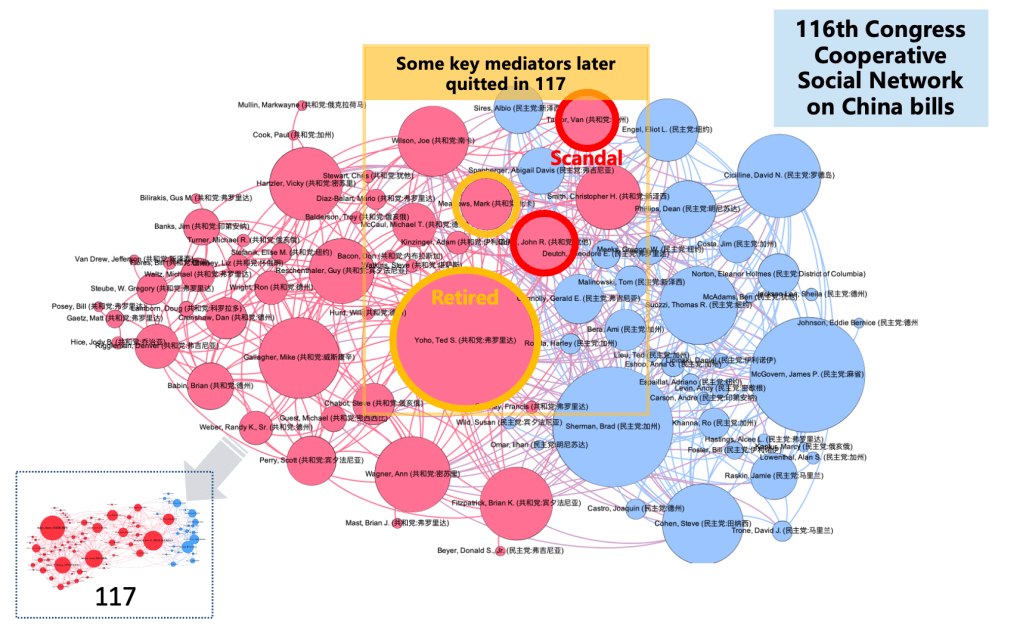
The two graphs above illustrate the cooperation on bills related to China in the 116th and 117th Houses of Representatives. The most significant change is the reduction in bipartisan cooperation in the 117th House compared to the 116th House. This is due to some key lawmakers leaving Congress due to retirement or other reasons, resulting in a “structural hole” in the social network of the 117th Congress, with only one or two lawmakers maintaining contact between the two parties. These changes are also reflected in the data, as the percentage of bipartisan co-sponsorship for bills related to China decreased from 44% in the 116th Congress to 30% in the 117th Congress. This also led to a decrease in the overall passage rate of bills related to China.
Another noteworthy inference is that bills proposed or supported by lawmakers in key social network positions have a higher probability of passage in their respective chambers. This inference is also supported by the data. For example, Congressman Brian Fitzpatrick, who occupies a structural hole position in the 117th Congress, has a bill’s passage probability of up to 24% for China-related bills in the House of Representatives, far higher than the typical 8.5%. In contrast, Congressman Brian Babin, who is socially more important in the House but cannot achieve bipartisan consensus, has a bill’s passage probability of only 9.8%
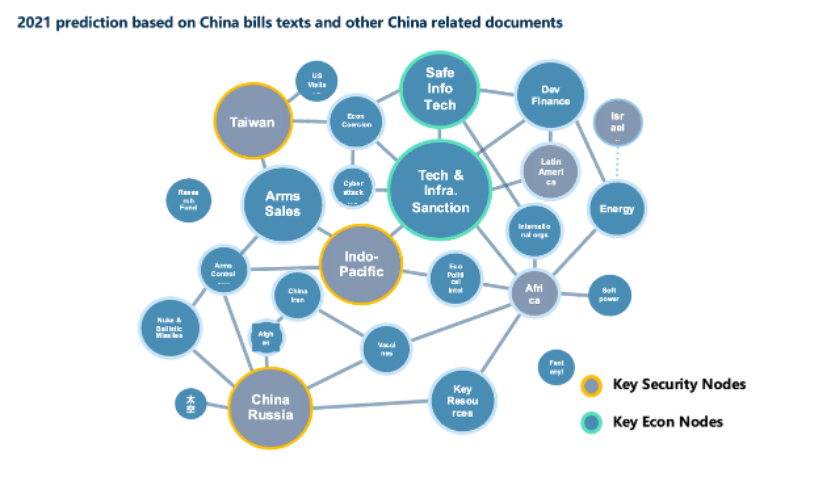
The role of analyzing legislative big data is not limited to predicting individual bills. We can also use data analysis techniques to better understand the overall landscape and trends in U.S. policy. For example, we can conduct topic network analysis using all data related to China legislation and policies to gain a better understanding of the broader U.S.-China policy landscape. The figure below shows an example of topic network analysis using data from 2020 to 2021, demonstrating that the key focus of future U.S.-China policy lies in the Taiwan Strait, the Indo-Pacific region, and cooperation between China and Russia, with economic policy centered on technology and equipment sanctions. This analysis result aligns well with observations made later.

Leave a comment